Fascinating Mapping!
- Since there were several earthquakes for the past few weeks, I decided to find the map that illustrates potentially dangerous earthquake zones in the United States. The source of this map is http://www.neighborhoodlink.com/article/Community/Earthquakes, and it is a community website called Neighborhood Link. This map depicts where the earthquakes occurred and rated their damage scales with different intensities of black color. From the map, we can see that Los Angeles, the area on the very west side of California, has a high potential of experiencing earthquakes, and the intensity is likely to be comparatively higher than other states. Also, the Northwest corner of the United States and the central area, where Illinois, Kentucky, Tennessee, Arizona and Missouri intersect, are other earthquake hazard areas. I find this map interesting because it is presented in black and white color, which warns people that earthquakes are catastrophic and remind us to stay alert. Most importantly, people anticipated that 2012 will be the last year before the death of the earth due to natural disasters. So I think it would be a good idea to "stay alert" about which states are relatively dangerous in the US.
U.S.A. Places Map
City
People (apx.) in 2008 Source:
Times Square – New York, New York 37.6 million
Las Vegas Boulevard – Las Vegas, Nevada 30 million
National Mall – Washington, D.C. 25 million
Faneuil Hall Marketplace – Boston, Mass. 20 million
Disney World’s Magic Kingdom – Orlando, Fl. 17 million
Disney Land – Anaheim, California 14.9 million
Fisherman’s Wharf – San Francisco, California 14.1 million
Niagara Falls – Niagara Falls, New York 12 million
Great Smoky Mtn. National Park – Tenn., N.C. 9 million
Navy Pier – Chicago, Illinois 8.2 million
- For those excited travelers, here is a map that shows you the most visited places in the United States. Time Squares, which is located in New York city, is the most visited place. The second place belongs to Las Vegas Boulevard that is located in Nevada state, and the third one is the National Mall in the Washington, D.C. As you may realize, the most visited places concentrate in popular cities, including New York, San Francisco and Chicago. Therefore, do not hesitate whenever you are planning to take travel around the United States. For more information, please visit the source origin: http://mrnussbaum.com/pdfs/places.pdf. I assume the publisher of this map is Mr. Nussbaum, and no other publication information is provided. I find this map interesting because I love traveling and having the knowledge about where popular areas are is always a good start of the trip. But I wonder why the central areas are not as popular as the coast cities?
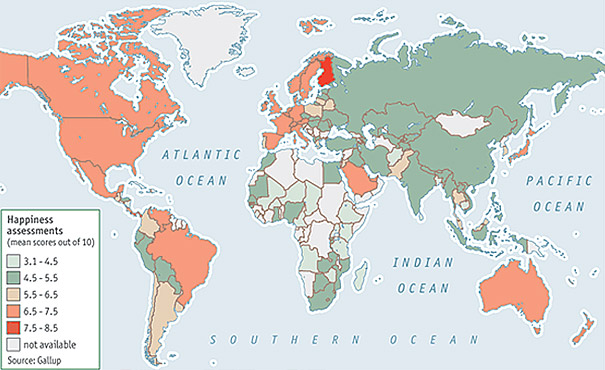
The World map of happiness

- This map represents the levels of happiness that people from different countries have. The Gallup researchers found evidence of what many have long suspected: money does buy happiness–at least a certain kind of it. The people from countries with redish colors are happier than the ones from countries with greenish colors. The source is http://www.boredpanda.com/maps-they-didnt-teach-you-in-school/, which is the URL of a blog named Bored Panda. This blog shows a lot of interesting maps people do not normally see in schools. As shown, the most happy country is located in Europe, but the country is not specifically identified from the source, but I guess it is Finland. People from developing countries, such as Russia, China and India, are less happy. Meanwhile, people from developed countries are happier. For example, United States and Canada. I find this map interesting because it provides connections between happiness and countries' economic conditions, and it also demonstrates how emotional satisfaction differs from countries to countries.
No comments:
Post a Comment